

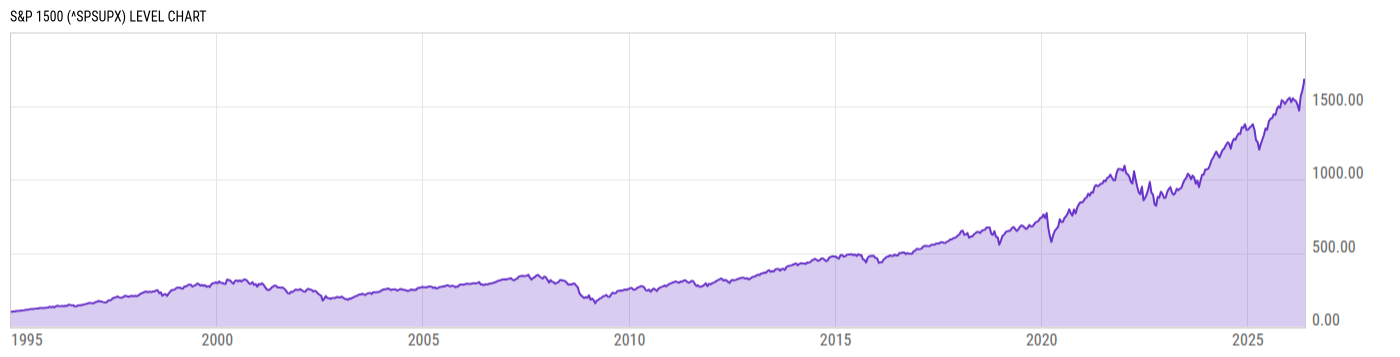
S&P 1500 (^SPSUPX)
1657.88
-1.15
(-0.07%)
USD |
May 18, 16:39
Level Chart
Key Stats
Basic Info
| The S&P 1500, or S&P Composite 1500 Index, is a stock market index of US stocks made by Standard & Poor's. It includes all stocks in the S&P 500, S&P 400, and S&P 600. This index covers 90% of the market capitalization of U.S. stocks. The index was launched on May 18, 1995. | |
| Core Index Name | S&P 1500 |
| Return Type | Price Return |
| Currency Code | USD |
| Category Hedge Type | Not Hedged |
Index Varieties
| Return Types | |
| Net Total Return | S&P 1500 Net Total Return |
| Total Return | S&P 1500 Total Return |
| Currencies | |
| CAD | S&P 1500 CAD |
Total Return Performance
As of May 15, 2026.
Returns for periods of 1 year and above are annualized.
Annual Performance
As of May 18, 2026.
Basic Info
| The S&P 1500, or S&P Composite 1500 Index, is a stock market index of US stocks made by Standard & Poor's. It includes all stocks in the S&P 500, S&P 400, and S&P 600. This index covers 90% of the market capitalization of U.S. stocks. The index was launched on May 18, 1995. | |
| Core Index Name | S&P 1500 |
| Return Type | Price Return |
| Currency Code | USD |
| Category Hedge Type | Not Hedged |
Index Varieties
| Return Types | |
| Net Total Return | S&P 1500 Net Total Return |
| Total Return | S&P 1500 Total Return |
| Currencies | |
| CAD | S&P 1500 CAD |